Cool Stuff in R
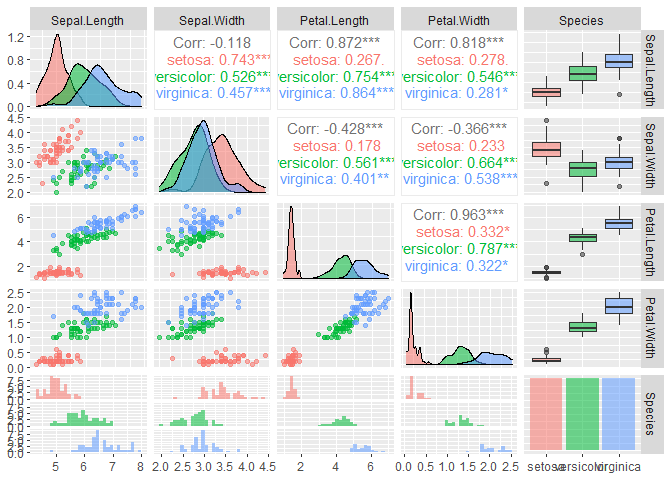
I like to visually summarize data. I like how you can write only a few lines of code and get some pretty great graphs (see below). In my example, with just one line of code, I can compare all five variables in one graph. I can look at their distributions, spread, and correlations with each other. I also like how you can loop through or use apply() to make multiple outputs, like graphs.
The ggplot2 package makes this easy, allowing the user to add layers to their graphs. For example, you can overlay a Histogram over a Kernel Smoother. You can also customize it with colors and fills.
library(GGally)
ggpairs(iris, aes(colour = Species, alpha = 0.4))