Programming Background Info
Thoughts About R
I was first introduced to R programming my sophomore year of undergrad in 2018 when I did a project at NC State’s vet school over the summer. The goal was to create a species distribution based on a literature search of a parasitic bee mite in Asia. I combined my data from my literature search with geographical and environmental data (e.g., temperature and precipitation) and built a model using R. I relied heavily on our post-doc for help because I had never used R before. I found myself often confused by the strange language and intimidated by the errors and warnings I got.
I used R programming again during my senior year in the fall of 2019 when I took GN 427: Introductory Bioinformatics with Dr. David Reif. Again, I remember getting very frustrated with R, but I began to understand the errors I was getting as I became more familiar with the language.
I am currently an ORISE research intern at the U.S. Environmental Protection Agency. When I started back in December 2020, people weren’t allowed in the lab due to COVID-19, so I was given a computational project, lead by Dr. Richard Judson, that I’ve been working on ever since. For this project, I am using R to analyze and visualize cell-based in vitro data, zebrafish developmental toxicity data, transcriptomic data, and literature mining data to identify the mechanisms of chemicals with selective toxicity, or chemicals that produce developmental effects at concentrations lower than where cell stress is produced.
In the early days of my project, I found myself googling everything, from making simple data frames to how to make “for” loops. I also used the help page in R to learn more about the packages and functions I was using. It was very frustrating at times because it took me a long time to figure out how to do seemingly basic things. Slowly, I learned other strategies that helped me use R. For example, I use the browser() function to see how my loops in my function are running. Also, some of the data I work with is pretty large, so I break it down into smaller data frames so that I can get my code running well.
Now, I am able to code much faster and I have more confidence. I think R is truly like a foreign language: you have to fully immerse yourself in it in order to learn it. Once I was using it every day for my job in early 2021, I really began to catch on to it. The learning curve is tough, but I think that may be true for most programming languages. The only other statistical computer program I’ve used is JMP, back in 2019, so I don’t remember much. What I do remember is that I used it to perform statistical analyses, like ANOVAs, and create graphs with its point-and-click setup. Naturally, I thought JMP was easier to use than R because it didn’t require code. I was used to point-and-click because I was comfortable with using excel. However, one major drawback to JMP is you can’t save your process, unlike R. Again, I used JMP back in 2019, so it may have changed. I like how you can document your thought process in R with code and comments. In addition, I believe that R can create nicer graphs than JMP.
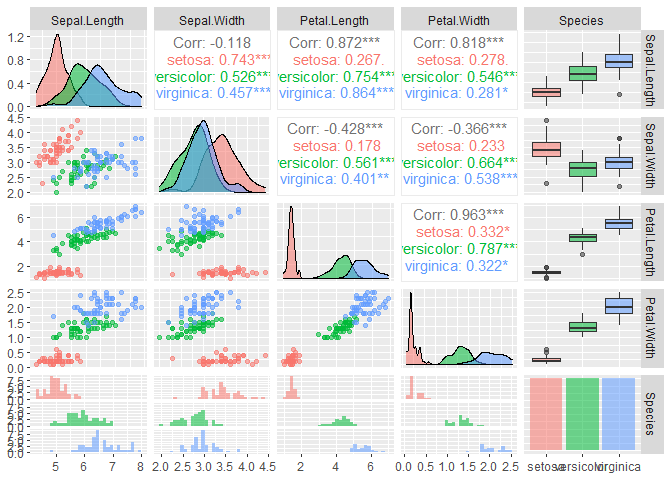
Example R Markdown Output:
plot(iris) #prints a plot about iris dataset (50 flowers from 3 different species)